|
|
|
|
|
|
|
|
|
|
|
|
|
|
|
|
|
|
|
|
|
|
|
|
|
|
|
|
|
|
|
|
|
|
|
|
|
|
|
|
|
|
|
|
|
|
|
|
|
|
|
|
|
|
|
|
|
|
|
|
|
|
|
|
|
|
|
|
|
|
|
|
|
|
|
|
|
|
|
|
|
|
|
|
|
|
|
|
|
|
|
|
|
|
|
|
|
|
|
|
|
|
|
|
|
|
|
|
|
|
|
|
|
|
|
|
|
|
|
|
|
|
|
|
|
|
|
|
|
|
|
|
|
|
|
|
|
|
|
|
|
|
|
|
|
|
|
|
|
|
|
|
|
|
|
|
|
|
|
|
|
|
|
|
|
|
|
|
|
|
|
|
|
|
|
|
|
|
|
|
|
|
|
|
|
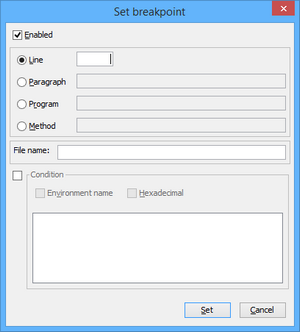
Usage: break [-d] { LineNumber | ParagraphName } [SourceCode] [when WhenConditions]
LineNumber is the line number to which the breakpoint refers. That line must contain a statement. If a statement is split between several lines, the breakpoint can only be set at the first line.
ParagraphName is the name of a paragraph. The breakpoint will refer to its first line.
SourceCode is the optional name of the source code to which LineNumber and ParagraphName refer. If SourceCode is not specified, the current source code is implied.
WhenConditions is: [-x][-env] VariableName Operator Value [LogicalOperator VariableName Operator Value] ...
LogicalOperator can be either && or II.
Value is the value to be tested.
if -x is used, the value is hexadecimal
if -env is used, the variable is searched for amongst configuration properties
|
|
|
|
|
|
|
|
|
|
Usage: clear { LineNumber | ParagraphName } [SourceCode]
LineNumber is the line number where the breakpoint is set.
ParagraphName is the name of the paragraph where a breakpoint is set.
SourceCode is the optional name of the source code that LineNumber and ParagraphName refer to. If SourceCode is not specified, the current source code is implied.
|
|
|
|
|
|
|
|
|
|
|
|
|
|
|
|
Usage: directory [DirectoryName]
If DirectoryName is omitted, then the current debugger code prefix is shown. Otherwise, the directory specified by DirectoryName is added to the debugger code prefix. See iscobol.debug.code_prefix for more information on the debugger code prefix.
|
|
|
|
|
|
|
|
|
|
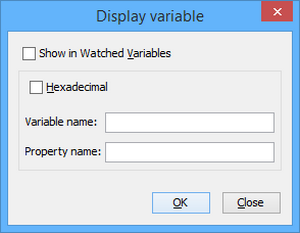
Usage: display [-x] [-tree] VariableName
VariableName is the data item whose value will be displayed.
|
|
|
|
Usage: display ControlHandle [ property | prop ] PropertyName
|
|
|
|
|
|
|
|
|
|
|
|
Usage: display -env VariableName
VariableName is the name of the environment variable to be displayed.
|
|
|
|
|
|
|
|
|
|
|
|
|
|
|
|
VariableName is the name of the environment variable to be displayed.
|
|
|
|
|
|
|
|
|
|
|
|
|
|
|
|
|
|
|
|
|
|
|
|
|
|
|
|
|
|
|
|
|
|
|
|
|
|
|
|
|
|
|
|
|
|
|
|
|
|
|
|
|
|
|
|
|
|
|
|
|
|
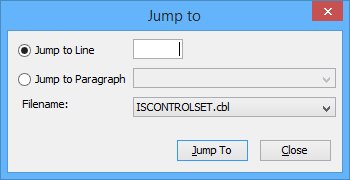
Usage: jump line-number [filename]
Note: Jumping to lines that are inside blocks is not allowed. In this case the Debugger jumps to the beginning of the block.
|
|
|
|
|
|
|
|
|
|
|
|
|
|
|
|
|
|
|
|
|
|
|
|
|
|
|
|
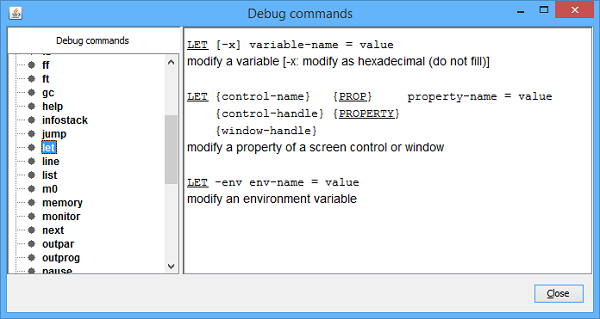
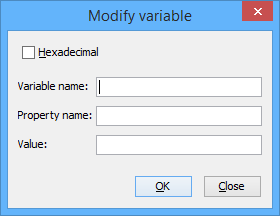
Usage: let [-x] VariableName=VariableValue
When "-x" is specified, a hexadecimal value must be entered.
|
|
|
|
Usage: let ControlHandle [ property | prop ] PropertyName=PropertyValue
|
|
|
|
Usage: let -env VariableName=VariableValue
|
|
|
|
|
|
|
|
|
|
|
|
|
|
|
|
|
|
Usage: m0 [-d][classname][methodname]([signature])
If classname is not specified, the breakpoint is set on the current debugged class. If signature is not specified and there is only a method named methodname, the breakpoint is set on that method. signature is a comma separated list of class names or primitive types names,
|
|
|
|
|
|
|
|
|
|
|
|
|
|
|
|
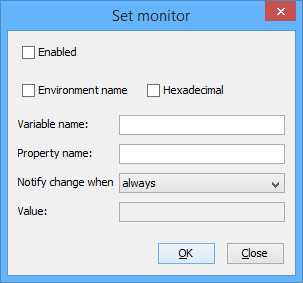
Usage: monitor [-d] [-e] [-x] VariableName [ when Operator Value | always | never ]
Value is the value to be tested. If you need to include leading or trailing spaces in the value, delimit it by quotes.
When "-d" is specified, the monitor is disabled and its value in the Information Window is not updated.
When "-e" is specified, the monitor is enabled and its value in the Information Window is updated.
When "-x" is specified, the value is hexadecimal.
When the "always" phrase is specified, the debugger is activated each time the value changes.
|
|
|
|
|
|
Usage: monitor [-d][-e] ControlHandle [ property | prop ] PropertyName [ when Operator PropertyValue | always | never ]
PropertyName is a the name of the property of ControlHandle to monitor.
When "-d" is specified, the monitor is disabled and its value in the Information Window is not updated.
When "-e" is specified, the monitor is enabled and its value in the Information Window is updated.
When the "always" phrase is specified, the debugger is activated each time the value changes.
When the "never" phrase is specified, the debugger is never activated, but the value in the Information Window is always updated.
|
|
|
|
Usage: monitor [-d][-e] -env VariableName
When "-d" is specified, the monitor is disabled and its value in the Information Window is not updated.
When "-e" is specified, the monitor is enabled and its value in the Information Window is updated.
VariableName is the name of the environment variable to monitor.
|
|
|
|
|
|
|
|
|
|
|
|
|
|
|
|
|
|
|
|
|
|
|
|
|
|
|
|
|
|
|
|
|
|
|
|
|
|
|
|
|
|
|
|
|
|
|
|
|
|
|
|
|
|
|
|
|
|
Executes the current statement. If it is a PERFORM statement, the first statement of the paragraph or session that it refers to becomes current. If n is specified and it’s greater than 1, the step command is automatically repeated n times.
|
|
|
|
|
|
|
|
|
|
|
|
|
|
|
|
|
|
|
|
|
|
|
|
|
|
|
|
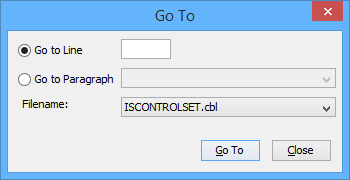
Usage: to LineNumber [SourceCode]
SourceCode is the optional name of the source code to which LineNumber refers. If it is not specified, the current source code is implied.
|
|
|
|
|
|
|
|
|
|
|
|
|
|
|
|
|
|
|
|
|
|
Usage: unmonitor [-env] VariableName
|
|
|
|
|
|
|
|
|
|
|
|
|
|
|
|
|
|
|
|
|
|
|
|
|
|
|
|
|
|
|
|
|
|
|
|
|
|
|
|
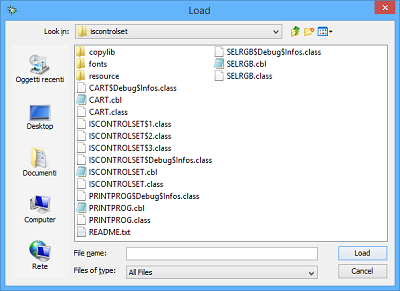
Usage: writesession [FileName]
FileName is the name of the file that contains the debugger configuration. If it is not specified, ' ISCONTROLSET.isd' is implied.
|