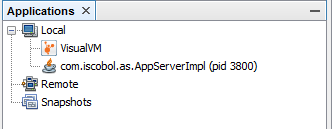
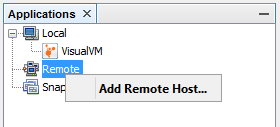
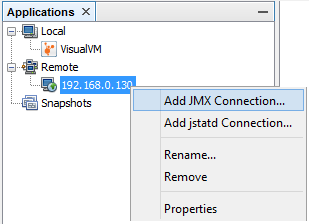
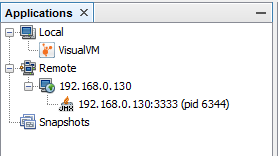
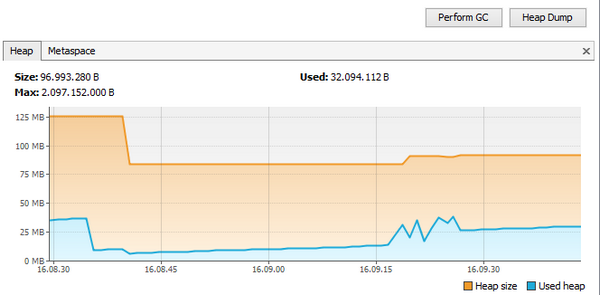
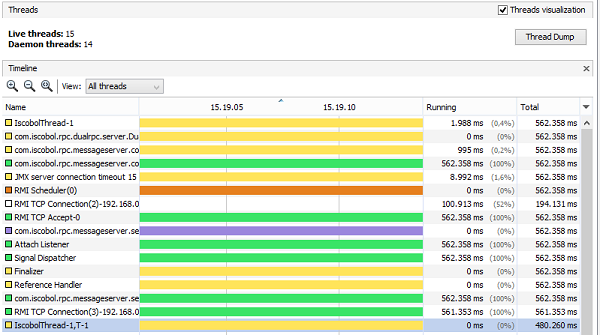
Tuning and monitoring isCOBOL Server with JvisualVM JvisualVM is a Java virtual machine monitoring, troubleshooting, and profiling tool. It's installed along with the Java Development Kit (JDK). In this chapter we're going to see how to monitor the isCOBOL Server activity and the load using JvisualVM. The JvisualVM executable file is found in the JDK bin directory. Launching JvisualVM and attaching the isCOBOL Server process When JvisualVM starts, it lists all the Java applications running on the local machine along with their PID. You should find the isCOBOL Server among these applications. The name of the application changes depending on the command that you used to start the isCOBOL Server. command application name shown by JvisualVM iscserver.exe (Windows) C:.Program Windows service Local Application iscserver (Linux/Unix) com.iscobol.as.AppServerImpl java com.iscobol.as.AppServerImpl com.iscobol.as.AppServerImpl In order to monitor the isCOBOL Server process, you have to attach it. Just double click on the application name in the tree or right click on it and choose "Open" from the pop-up menu. Note - the process may not appear in the list if: • the JDK version from which you started JvisualVM is different than the Java version used by isCOBOL Server • only on Windows, JvisualVM was launched with different Administrator privileges than isCOBOL Server. Connecting to a remote isCOBOL Server process Sometimes it’s not possible to start JvisualVM on the same machine where isCOBOL Server is running. In this case you have to set up a remote JMX connection. The most common case is where the server is a Linux/Unix box where no graphical desktop is available, so in this guide we’re going to see how to set up the JMX connection on Linux and how to attach it from a Windows client. Assume that the IP address of the Linux server is 192.168.0.130. First of all, we need to dedicate a port to the JMX connection. In this example, we’re using port 3333. Change the isCOBOL Server startup command as follows: iscserver -J-Dcom.sun.management.jmxremote.port=3333 \ -J-Dcom.sun.management.jmxremote.ssl=false \ -J-Dcom.sun.management.jmxremote.authenticate=false \ -J-Djava.rmi.server.hostname=192.168.0.130 After the isCOBOL Server has been started, • run JvisualVM on a Windows machine in the same network as your Linux server • right click on "Remote" in the Applications tree and choose "Add Remote Host..." • fill the "Host name" field with the IP address of the Linux server and click OK • the IP address appears as child item of Remote in the tree. Right click on it and choose "Add JMX Connection..." • in the "Connection" field, put the port number 3333 after the colon and click OK. • the isCOBOL Server application will appear as a new child in the tree: In order to monitor the isCOBOL Server process, you have to attach it. Just double click on the application name in the tree or right click on it and choose "Open" from the pop-up menu. JvisualVM’s Monitor page The Monitor page allows to monitor in real time the CPU and memory usage of the whole isCOBOL Server as well as the number of loaded classes and active threads. You should pay particular attention to the Heap monitor. The Heap is the amount of RAM memory that is used to store resources pointed by COBOL handles like bitmaps, fonts, ESQL cursors, etcetera. This memory has an initial size that can be configured through the -Xms Java option and a maximum size that can be configured through the -Xmx Java option. The Heap usage increases when the COBOL application loads a new resource and decreases when a garbage collection is performed. The garbage collection is a procedure that takes care of removing inactive resources (e.g. a font or a bitmap whose handle has been destroyed) from the Heap memory. This procedure is automatically triggered by the JVM when the Heap usage is near the maximum amount of memory available or when the JVM is idle. You can force a garbage collection from the JvisualVM screen by clicking the "Perform GC" button. Be aware that this procedure consumes CPU and it may slow down connected clients that are working. The "Heap Dump" button allows to take a snapshot of the Heap in a given moment. By analyzing this snapshot you can find out which classes are using most of the memory. JvisualVM’s Threads page The Threads page lists all the threads that were created in the isCOBOL Server’s JVM. By default all threads are shown, including the ones that are no more running. You can filter the list using the "View" combo-box on top of the list. The list includes a timeline that shows how the threads state changes as time goes by. There are five possible states: Sate Meaning Running The thread is running. In a COBOL application this is the typical state during a elaboration like a cycle that reads records from a file and processes them. Sleeping The thread is sleeping. In a COBOL application this is the typical state of a program that called the C$SLEEP routine and is waiting for the call to return. Wait The thread was blocked by a mutex or a barrier, and is waiting for another thread to release the lock. In a COBOL application this is the typical state of a program that is accepting user input with an ACCEPT statement. Park Parked threads are suspended until they are given a permit. Monitor The thread is waiting on a condition to become true to resume execution. The isCOBOL Clients connected to the isCOBOL Server can be identified by their name: IscobolThread-# This is the main thread of the isCOBOL Client. # is the thread ID (TID) assigned to that Client. You can retrieve more information about the Client whose thread ID is # by running the isCOBOL Server’s administration panel. IscobolThread-#,T# This is a COBOL thread started from the COBOL application using either CALL THREAD or PERFORM THREAD statements. The first # is the TID of the Client, while the second # is a progressive number assigned by the isCOBOL Framework. IscobolThread-#,R# This is a COBOL thread started from the COBOL application using the CALL RUN statement. The first # is the TID of the Client, while the second # is a progressive number assigned by the isCOBOL Framework. A IscobolThread that stay in Running state without changing to Wait or Sleeping for a lot of time means that the Client may be in a infinite loop and it could slow down all the other connected Clients. You can take advantage of the administration panel in order to check which program and paragraph are being executed by that thread. The "Thread Dump" button allows to take a snapshot of the threads in a given moment. By analyzing this snapshot you can see the state and the stack of each thread. Measuring the load of your COBOL application JvisualVM can help you calculating the amount of RAM that is necessary for your COBOL application to run in thin client mode with a given number of concurrent users. Suppose that you’re going to install your COBOL application on a production server where 100 users will connect and you need to suggest the amount of RAM that the server machine should provide. You can calculate it empirically in this way: 1. start the isCOBOL Server 2. attach isCOBOL Server with JvisualVM and take the current Heap usage (we’ll call this value "A") 3. connect with a Client and move among the programs of your application simulating data elaboration, printing and other stuff. Be sure to execute the most used functions of your application. 4. take the current Heap usage (we’ll call this value "B"). Now you can make the following calculation: Necessary_RAM = A + ((B - A) * number_of_users). Looking for memory leaks JvisualVM can help you finding memory leaks. The steps are similar to the ones described above: 1. start the isCOBOL Server 2. attach isCOBOL Server with JvisualVM and take the current Heap usage (we’ll call this value "A") 3. connect with a Client and move among the programs of your application simulating data elaboration, printing and other stuff. Be sure to execute the most used functions of your application. 4. exit from the application, the Client terminates. 5. force a garbage collection from JvisualVM 6. take the current Heap usage (we’ll call this value "B"). If B is greater than A, then a memory leak is possible. You should repeat steps from 3 to 6 multiple times to see if the difference between A and B increases.